


Potential government policy shifts could result in the addition of significant and varied decarbonisation requirements for real estate across the globe, writes Will Robson
The 2015 Paris Agreement seeks to keep the rise in global temperature to well below 2°C above pre-industrial levels, using 1.5°C as a “stretch goal”. To do this, many governments sought to define a path to limit global warming to below 2°C through nationally determined contributions (NDCs). In reality, many fell short of that target; in aggregate, they were estimated to limit global warming to only 3°C1.
Now many governments realise that keeping the global temperature rise to 1.5°C is critical to avoid some of the worst effects of climate change. As we head toward the COP26 conference in Glasgow in November, many governments might strengthen their NDCs as part of a renewed global effort to achieve net-zero by 2050 and align with 1.5°C warming.
For the real estate sector, we estimate that property assets will need to reduce their operational carbon emissions by 80% by 2034 – a much higher reduction, on average, than that embedded in a 2°C scenario2. Increased reduction requirements could have significant financial implications for real estate assets3.
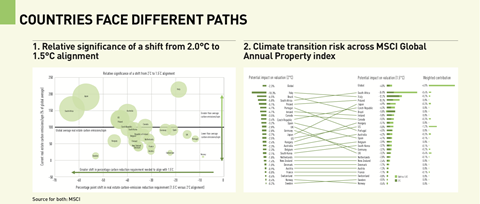
There is large variation in the carbon intensity of countries’ building stocks (as measured by carbon emissions per square metre per year). We applied country/property-type average carbon-emission-intensity proxies to assets within the MSCI Global Annual Property index4 to highlight the relationship between current relative emissions intensity and the magnitude of policy shifts required to align with 1.5°C versus 2°C warming5. In figure 1 the size of the bubbles represents the magnitude of that additional carbon-reduction requirement on a per-square-metre basis.
South Africa and Japan have the largest per-square-metre increase in carbon-reduction requirements, resulting from both high current carbon intensity and the need for a significant potential shift in policy. Although Italy has, on average, even more carbon-intense assets today, its current carbon-reduction targets are relatively ambitious, resulting in a smaller shift in reduction requirements when moving to 1.5°C alignment.
Notes:
1 Sample of assets excludes those for which climate value-at-risk could not be calculated due to lack of data.
2 ‘Emissions Gap Report 2019’. United Nations Environment Programme, Nov. 26, 2019.
3 The 80%-reduction requirement embedded in MSCI’s 1.5°C scenario is applied uniformly across all countries and sectors in contrast to variable requirements aligned to NDCs in the 2°C scenario. 80% is derived by applying fixed-percentage carbon-emission reduction per year, targeting zero by 2050. Please note that there are different potential pathways to achieve net zero by 2050. Please see, for example: ‘Characteristics of four illustrative model pathways’. Intergovernmental Panel on Climate Change.
4 Whole-building emissions are related to the consumption of energy produced on and off-site. This figure excludes carbon emissions from construction and demolition.
5 Average energy intensities are collected from various databases, including the EU Buildings Database and the US Energy Information Administration’s Commercial Buildings Energy Consumption Survey.
6 The analysis applies the same country/property-type carbon-emission proxies to assets within the MSCI Global Annual Property index.
The MSCI Climate VaR Model provides a measure of the potential impact on valuation arising from an assumed climate scenario.
As shown in figure 2, we used the model to assess how real estate assets within the MSCI Global Annual Property index might be affected by climate-policy scenarios designed to limit the increase in temperature to 2°C and 1.5°C6.Our analysis showed potential global valuation impacts of -2.3% and -4.0%, respectively.
Assets in Italy have, on average, the largest valuation impact under a 2°C scenario (-10.3%), but are overtaken by South African assets (-24.8%) in a 1.5°C scenario. Considering market weightings, the US contributes the most to the overall impact on the index, despite a relatively moderate standalone valuation impact of -5.0%.
Net-zero commitments and 1.5°C alignment are increasingly at the forefront of real estate investors’ minds. Granular asset and portfolio-level analysis of climate-transition risk across warming scenarios may help investors plan and prioritise action by identifying the key drivers. Such a road map could be key to a successful journey to net zero.